Chart Maker
Free with subscriptionPaste data, import Excel, or have it researched — review the table first, then pick from 22 chart types and export a PNG image or an animated MP4
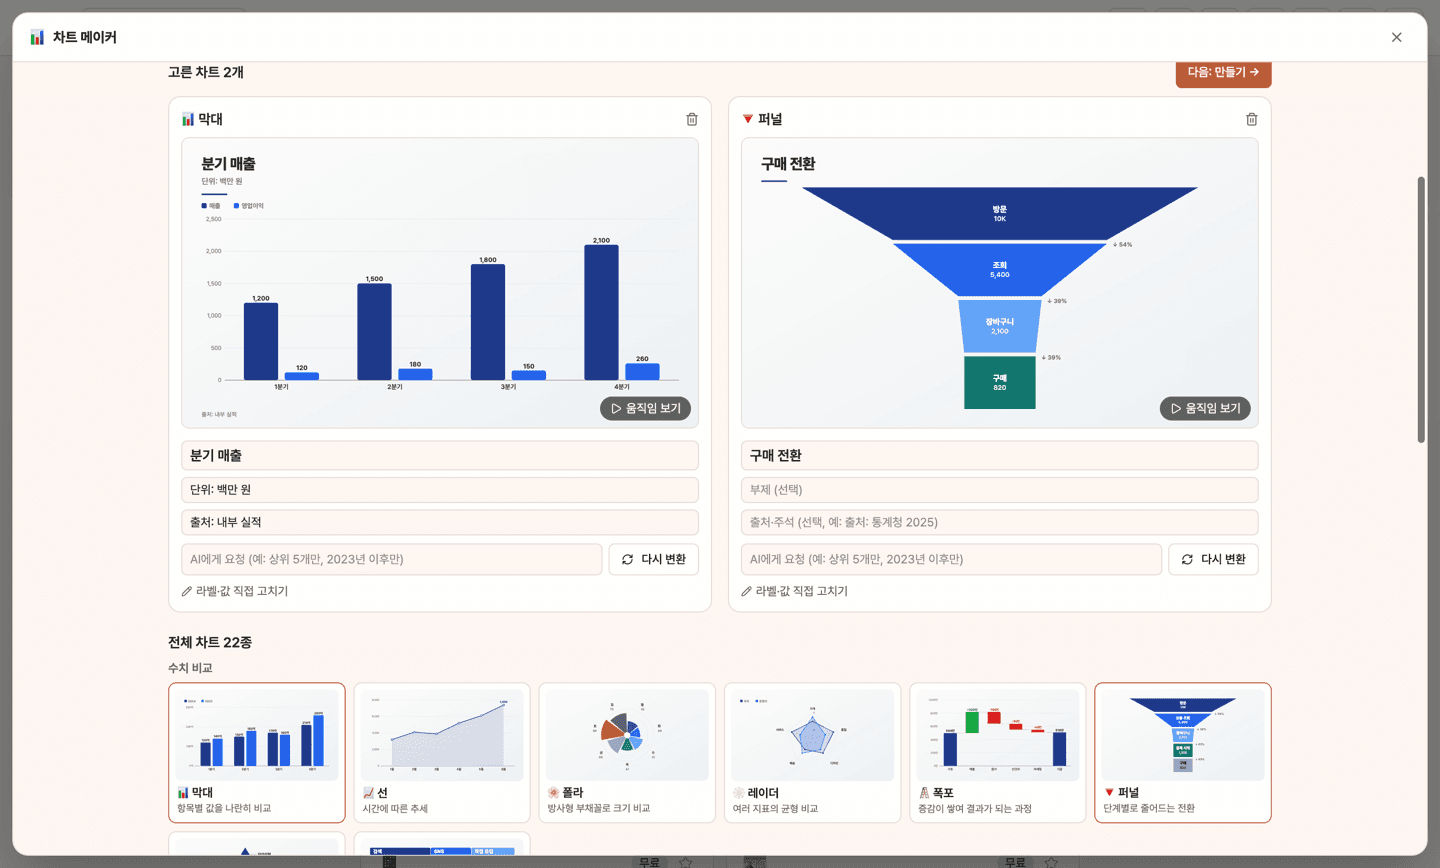
To create charts for reports, presentations, or social media, you usually have to format in Excel and even edit videos if you want animated charts. Chart Maker lets you simply paste your data, import from Excel or CSV, or just tell it "Research this data for me." It first shows you a table, then you can pick from AI-recommended charts or choose from 22 types, and export as a high-resolution image (PNG) or an animated video (MP4) where bars grow and lines are drawn.
Sign in and tap Use — the app appears inside DoDone.
Who it's for · what for
Office workers making reports or presentations
Paste your performance tables and export bar, waterfall, or funnel charts as PNGs to insert into your slides.
SNS or YouTube managers
Use research prompts to gather statistics and upload animated chart videos (vertical 9:16) as Reels or Shorts.
Planners, PMs, or consultants
Summarize workflows as flowcharts, schedules as Gantt charts, root causes as fishbone diagrams, and customer experiences as user journeys.
How to use
- 1[New Chart] → Paste your data, select an Excel or CSV file, or enter what you want to research.
- 2Check the table and edit cells, column names, or column types (text, number, date) if needed.
- 3Pick a chart from AI recommendations or the list of 22 types to instantly preview. Edit the title, source, or values, and use [Preview Animation] to check the animation.
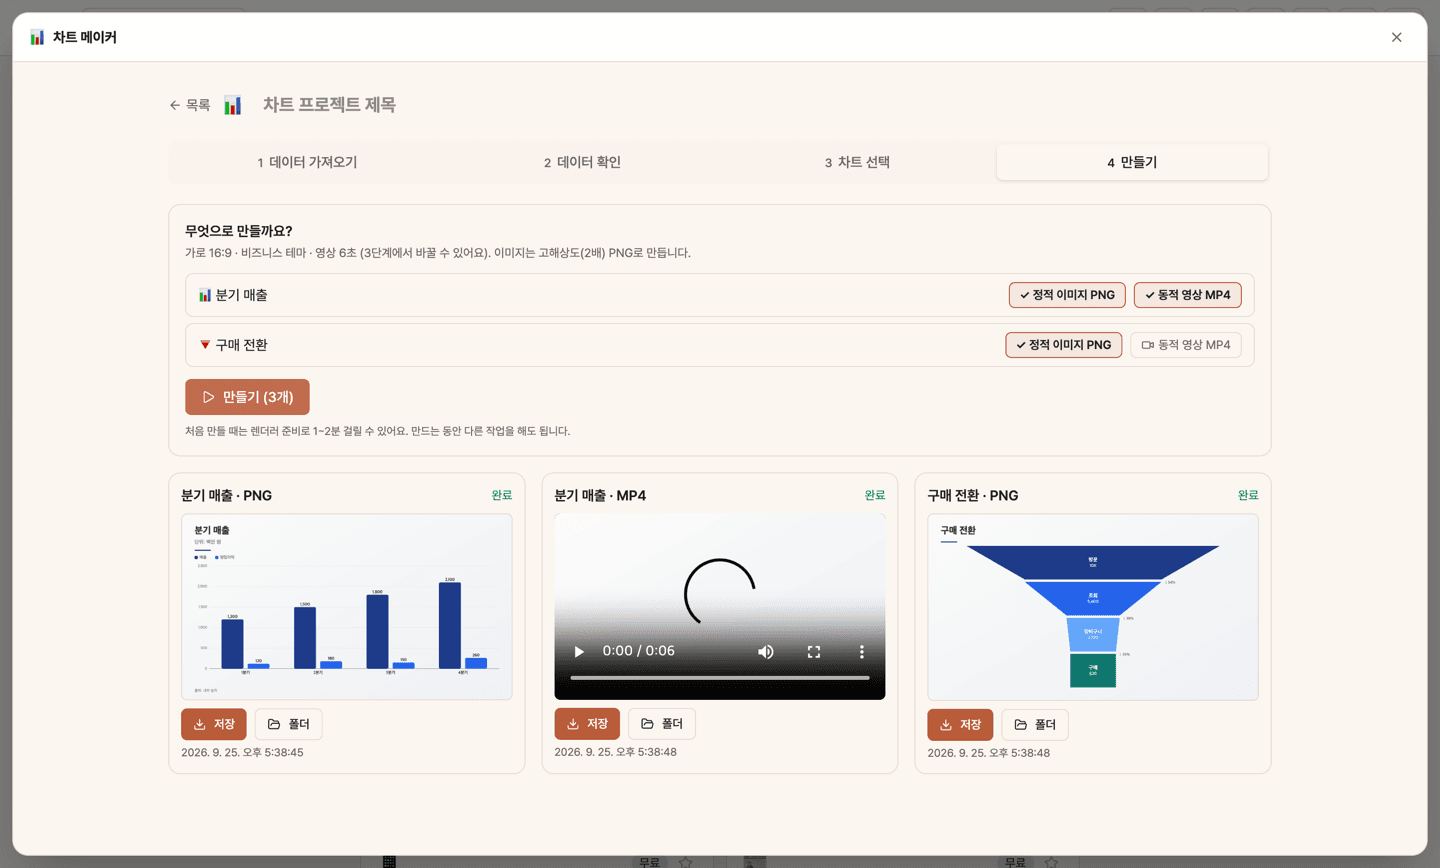
- 4In [Create], choose PNG or MP4 for each chart and [Save]. Change theme, aspect ratio (landscape, portrait, square), or video length in step 3.
Features in detail
Three ways in — paste · Excel/CSV · web research
Tables copied from Excel or Google Sheets become a table as-is, and plain text like "Q1 12M, Q2 15M…" is organized into one by AI. Import .xlsx or .csv files (pick the sheet), or give an instruction such as "annual EV sales in Korea, 2020–2025" and AI searches the web and builds the table with its sources. Whichever way you start, you see the table first and can edit cells, column names and column types.
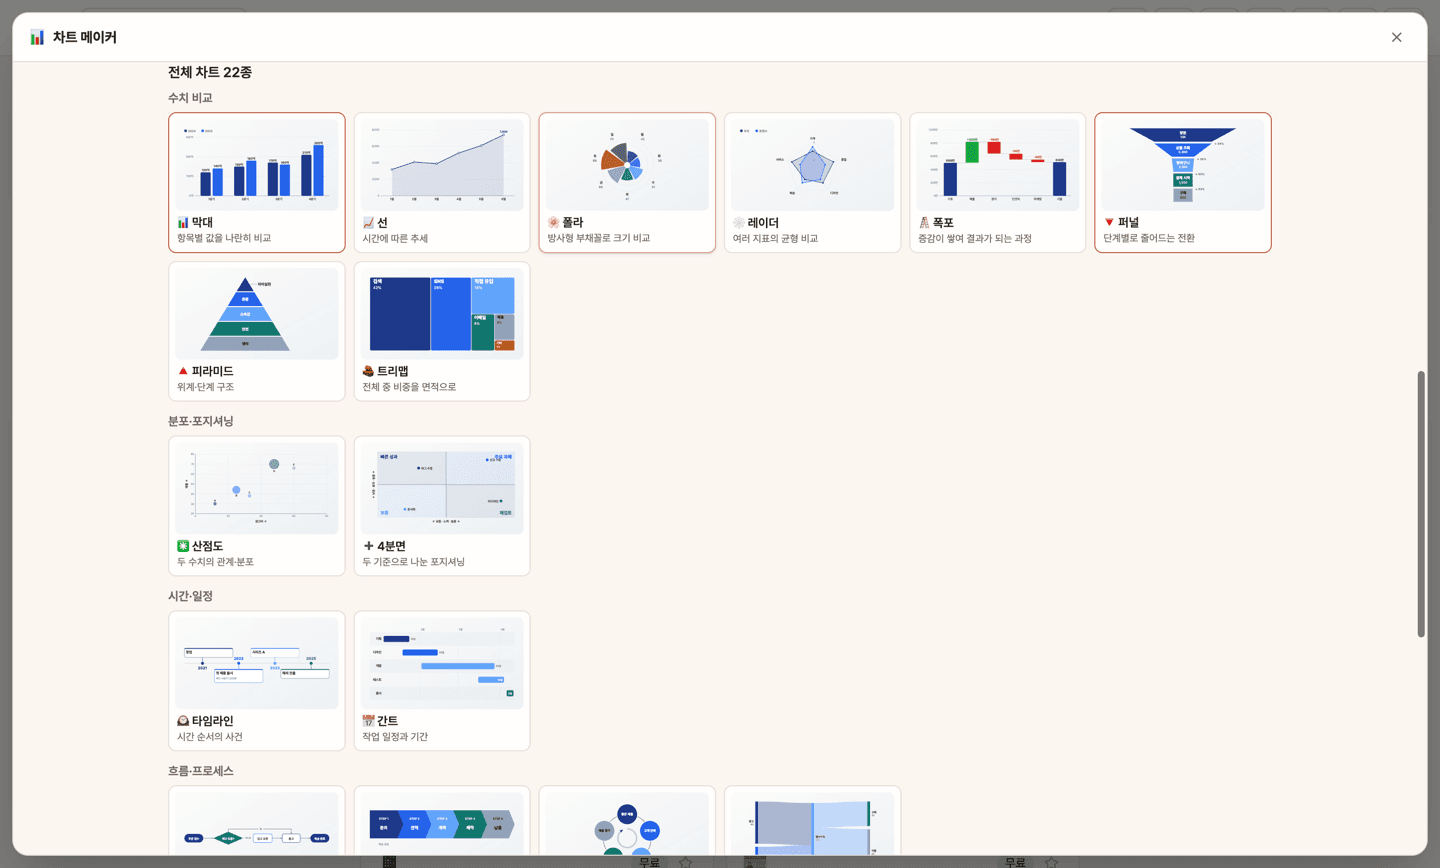
AI suggestions + 22 chart types · live preview
Bar, line, polar, radar, waterfall, funnel, pyramid, treemap, scatter, quadrant, timeline, Gantt, flowchart, process, loop (flywheel), Sankey, tree, nested, fishbone, Venn, kanban and user journey. AI suggests 3–5 charts that fit your data; pick one and AI reshapes the data into that chart for an instant preview. Edit the title, subtitle, source line, labels and values yourself, or re-convert with a request like "top 5 only". Five themes.
Static PNG or animated MP4
For each chart, export a high-resolution PNG (for slides and reports) and/or an MP4 where bars grow and lines draw themselves (6, 8 or 12 seconds — for reels, YouTube and presentations), in landscape, portrait or square. You can watch the motion in the preview first. Image and video export requires the video renderer (Remotion) plugin.
FAQ
Q.Can I trust the researched numbers?
AI shows both the values it found on the web and the source links. Official statistics are prioritized, but mistakes can happen, so always check the source before using. You can edit the table directly.
Q.Does my data have to be a table?
No. AI can turn text like processes, organizations, or causes into flowcharts, trees, fishbone diagrams, and more. For charts like bars or lines that need numbers, you’ll need at least one number column.
Q.What Excel file formats are supported?
.xlsx and .csv (UTF-8, Korean Excel CSV) files up to 20MB or 5,000 rows are supported. For older formats (.xls), please re-save as .xlsx in Excel.
Q.Is the video renderer required?
You can edit data, choose charts, and preview instantly. You only need to install the video renderer (Remotion plugin) once when exporting PNG or MP4 files.
This app — and every work app — is free for DoDone subscribers
New work apps keep shipping, at no extra cost while you're subscribed. Tap Use and run it from 'My Work Apps' inside DoDone.