엑셀 파일 만들어주는 AI. PPT 자동 생성 프로그램. AI로 보고서 PDF 만들기. 릴스 영상 만들어주는 AI. AI that creates Excel files. auto-generate PowerPoint decks. make PDF reports with AI. AI that makes reel videos. DoDone(도도네) — 워드·엑셀·PPT·PDF·HTML 슬라이드·이미지·릴스 영상까지 — 실제 파일로 받는 산출물 가이드. Word, Excel, PPT, PDF, HTML slides, images, and reel videos — deliverables as real files.
Document & Media Deliverables — Just Say It, Get the File
DoDone employees do more than just answer questions. They actually create Word, Excel, PowerPoint, PDF, web pages, slides, images, videos, music, and audio files for you. The AI determines the content and structure, and the file itself is generated by code, so formatting is never broken. Files are first saved to your computer and can be previewed or downloaded right next to the chat.
What Can Be Created
| Format | What It Makes | How to Request |
|---|---|---|
| Word (.docx) | Reports, proposals, draft contracts with cover, table of contents, tables, headers/footers | $word or "as a Word file" |
| Excel (.xlsx) | Tables with formulas, multi-sheet data organization | $excel or "as an Excel file" |
| PowerPoint (.pptx) | 12 layouts, 50+ brand themes, planning before creation, review before rendering | /pptx or "as a PPT" |
| Print-ready documents | "as a PDF" | |
| Sites (HTML) | Complete websites, landing pages, dashboards. Preview instantly after creation | "Make a landing page" |
| HTML Slides | Fullscreen slideshows navigated by keyboard, 12 infographic types, AI backgrounds | $html-slide |
| Images | Logos, banners, illustrations, card news, with follow-up edits | $image or "as an image" |
| Videos (Remotion) | Infographic and chart animation reels/shorts | "As a 30-second vertical reel" |
| Music | BGM, songs | "Calm acoustic BGM" |
| Audio (TTS) | Narration, dubbing, 30 voice types | "Read this sentence" |
Plugins must be enabled. Document plugins are on by default, while video, music, and audio plugins can be enabled in Plugins.
Examples
/pptx Create a 2026 business plan presentation. About 10 slides, Apple theme.$excel Organize this sales data by month in separate sheets and add total formulas+ file attachment$word Turn the above research results into a 2-page report. Summary → Current Status → Implications.Create a landing page introducing the new cafe menu. Use menu and prices from the Knowledge Base.$image Autumn new menu banner, warm tone, no textCreate a 30-second vertical reel introducing the new product
Editing Afterwards
After receiving a deliverable, just continue the conversation to get a revised version that keeps the context.
Change the 2-page table to a graphChange the title of slide 3,Add a slide with figures- (Image)
Change the background to a sunset,Make only the text bigger
More About HTML Slides
When you select $html-slide, a panel with 6 themes (Midnight, White, Aurora, Paper, Sunset, Deep Blue) opens. The employee first suggests the number of slides and table of contents, then creates the slides after your confirmation. The result is a single HTML file: navigate with ←/→, press F for fullscreen, numbers animate with a count-up effect, and the cover includes an AI-generated background image.
Automatic Chart Insertion
When creating reports (Word, PDF, HTML, long-form drafts) and Word or PowerPoint files, if the content includes comparisons, trends, proportions, processes, schedules, causes, or structures, the employee automatically inserts charts. There are 22 types (bar, line, waterfall, funnel, treemap, Sankey, Gantt, flowchart, fishbone, Venn, user journey, etc.) just like the Chart Maker, and each chart in the document is labeled and captioned, e.g., "Figure 1. Quarterly Sales."
- Usually 1–5 charts per document. If you say "without charts", none are included; if you say "lots of charts", more are added.
- Only values present in your data are used in charts. Estimated numbers like goals or forecasts are written in the text, not charted.
- Data that's hard to chart (mixed units or non-numeric values) is inserted as a table in the same place.
- In PowerPoint, simple numeric comparisons use standard charts, while flows, schedules, causes, and structures use diagram slides.
- Works without installing plugins. Charts in PDF and HTML are crisp vectors even when zoomed in.
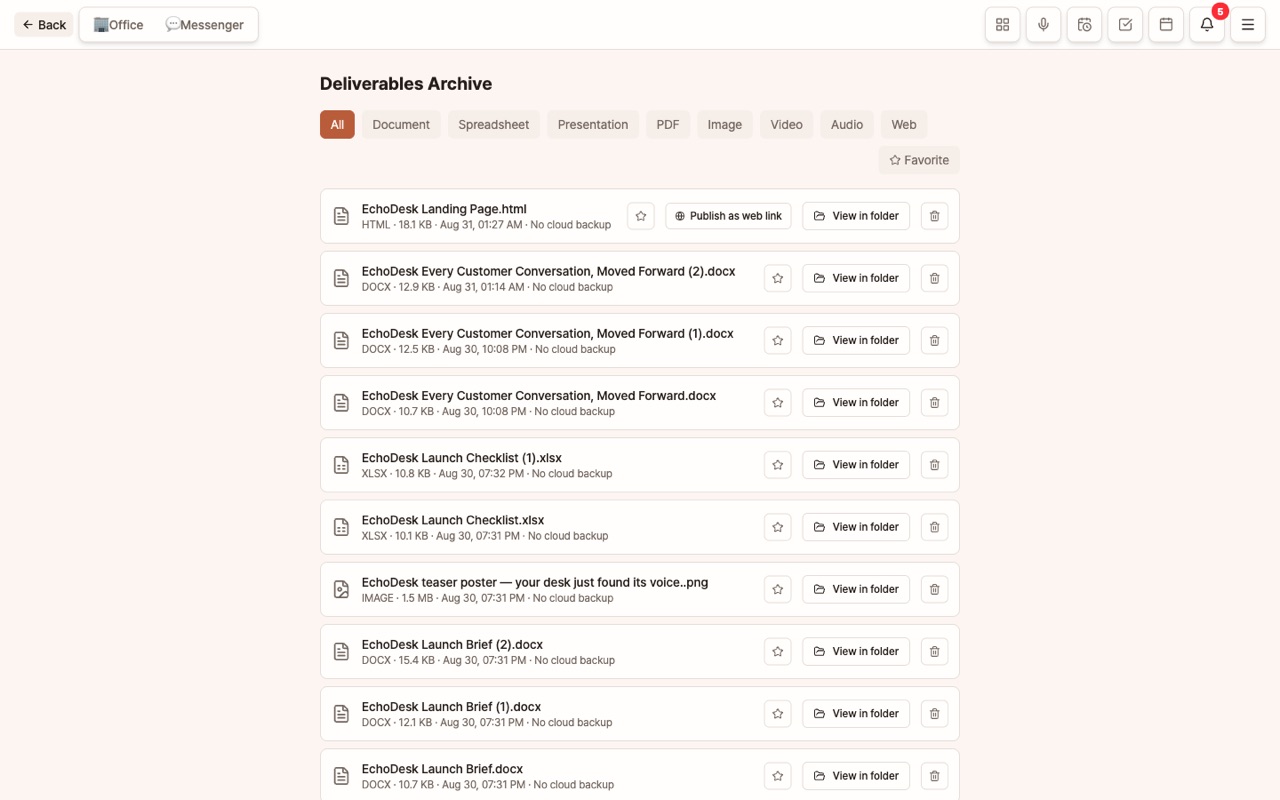
Deliverables Archive
All files are gathered in Menu (≡) > Deliverables. You can preview, download, open in folder, or delete files, and filter by format, employee, or date range. The [Deliverables] button at the top of the chat shows only files created in that chat.
- Work Folder: You can specify a local folder to read files from and save results to.
- Files are first saved to your computer, and backed up to your Supabase storage. Backup failures do not cause the job to fail.
How to Use
- State the format first. If you say "in Excel" or "as a PDF," the appropriate tool will be attached.
- For presentation materials, specify the number of slides. For example, "around 10 slides."
- If text needs to be included in an image, write the exact phrase, and if there are any mistakes after it's generated, request corrections.
- If you add your company logo and colors to the Knowledge Base, they will be reflected in your document and slide themes.
FAQ
Q: Where are deliverable files saved?
They are first saved on your computer and backed up to your Supabase. They are not stored on the DoDone server.
Q: Images are not being generated.
Go to Settings > Model and check that at least one image model is registered. If the OpenAI image model is empty, it will be replaced with the Gemini image model.
Q: Videos are not coming out as files.
Go to Settings > Plugins and make sure Remotion (Video) is turned on. The first time you turn it on, installation may take some time.